
LPL Financial
Practice Hub for independent wealth advisors
14 weeks
62% of pilot advisors set a growth goal in their first week — a behaviour the platform had never produced before.
The business problem
LPL grows when its advisors grow, and the largest segment was the slowest.
LPL custodies assets for roughly 20,000 independent advisors, and its revenue is a function of their AUM and production. The small-to-mid practices are the biggest segment by headcount, the slowest growing by assets, and the most likely to move their book to a competing broker-dealer when they feel unsupported. The only growth support LPL had was human: consultants, who cannot cover a twenty-thousand-advisor tail.
LPL was not short of data. It had every metric on every practice it custodies. What it did not have was a product that turned that data into advice, which meant an enormous informational advantage sat in reporting tools nobody opened twice.
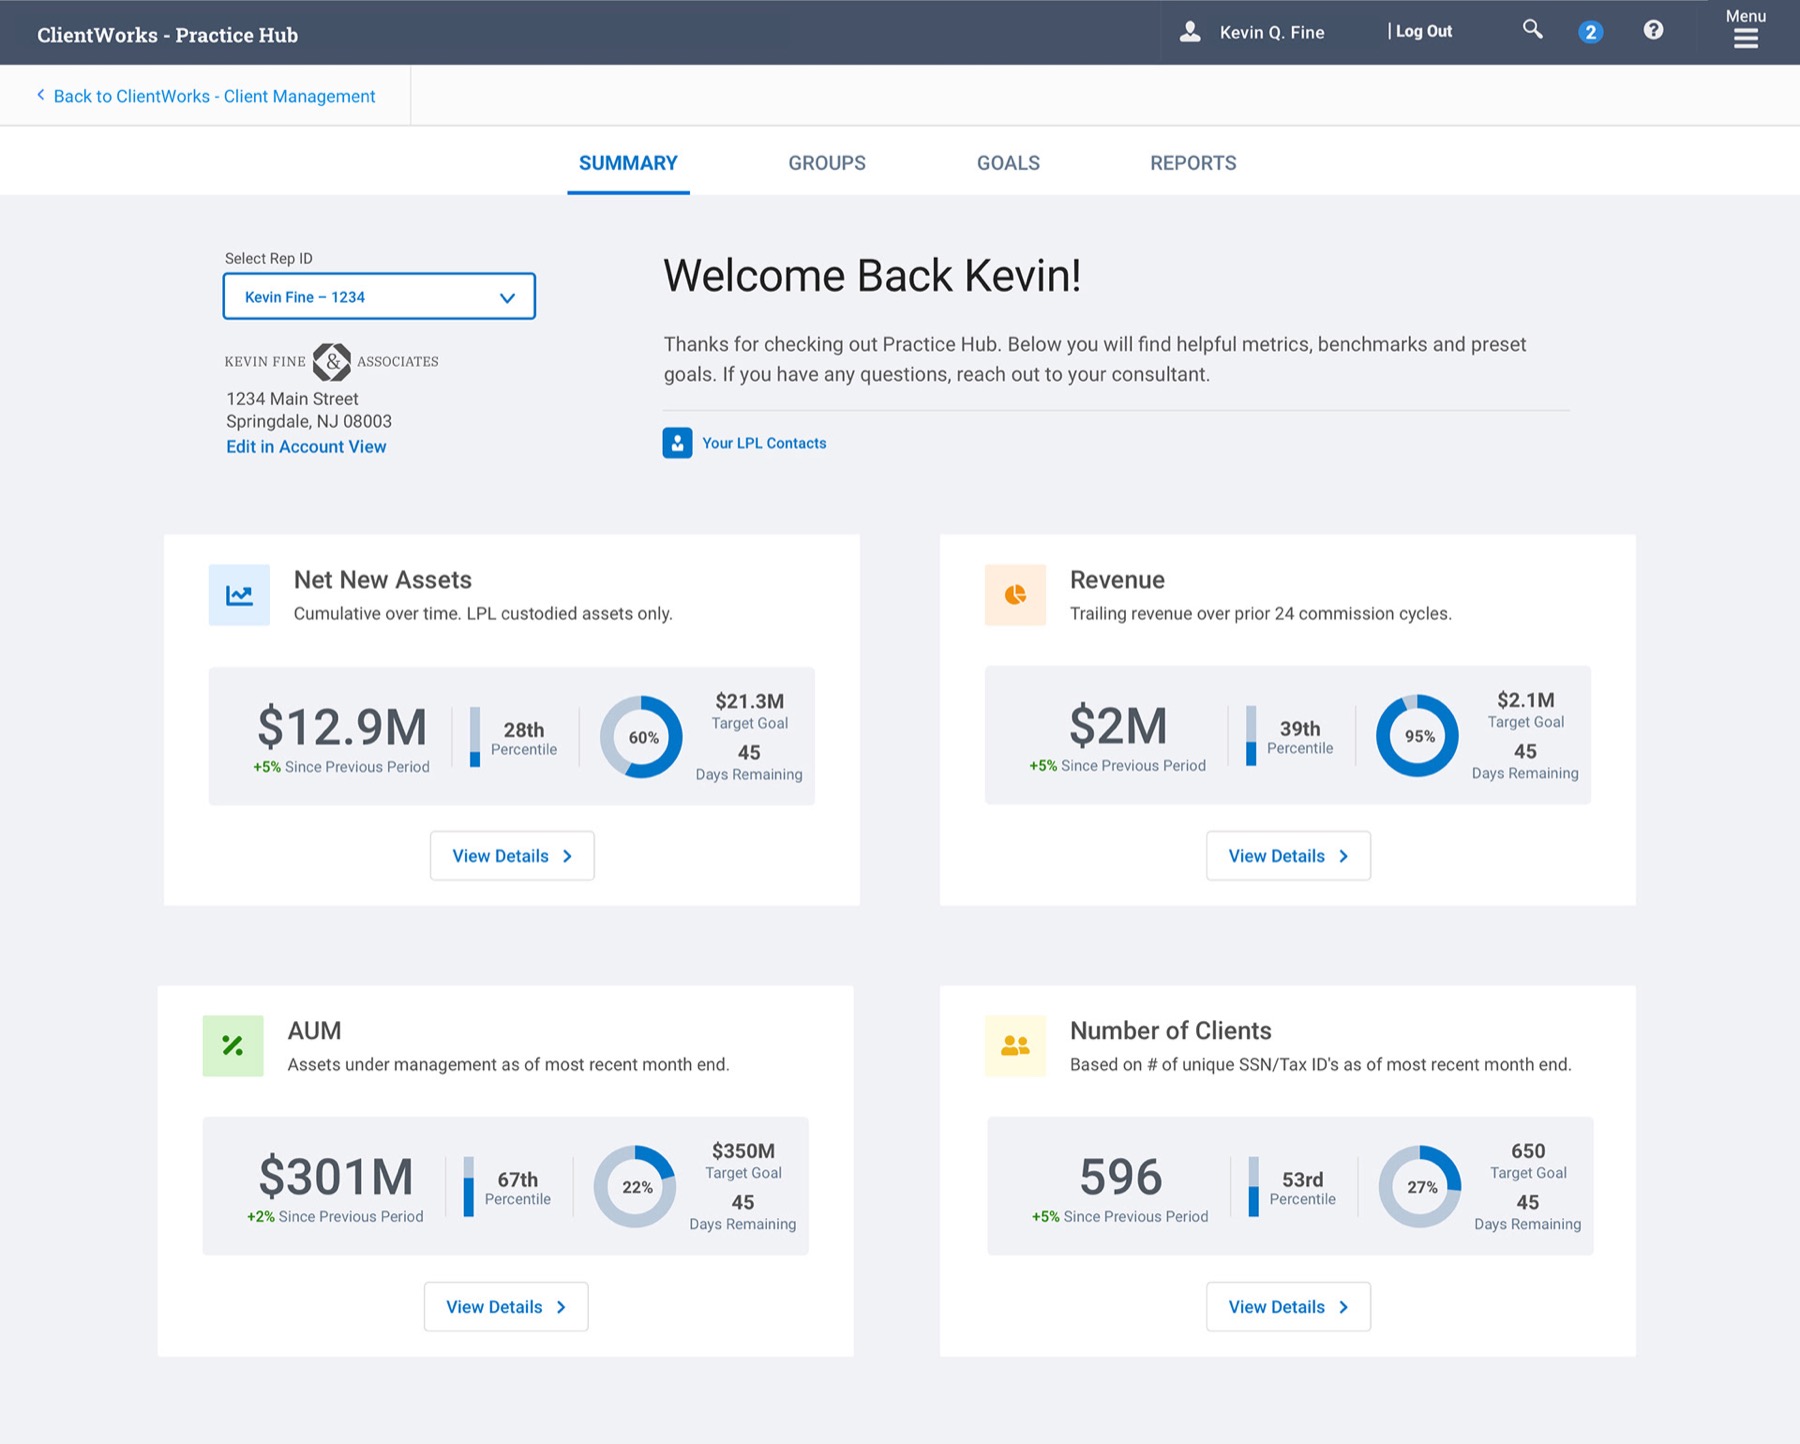
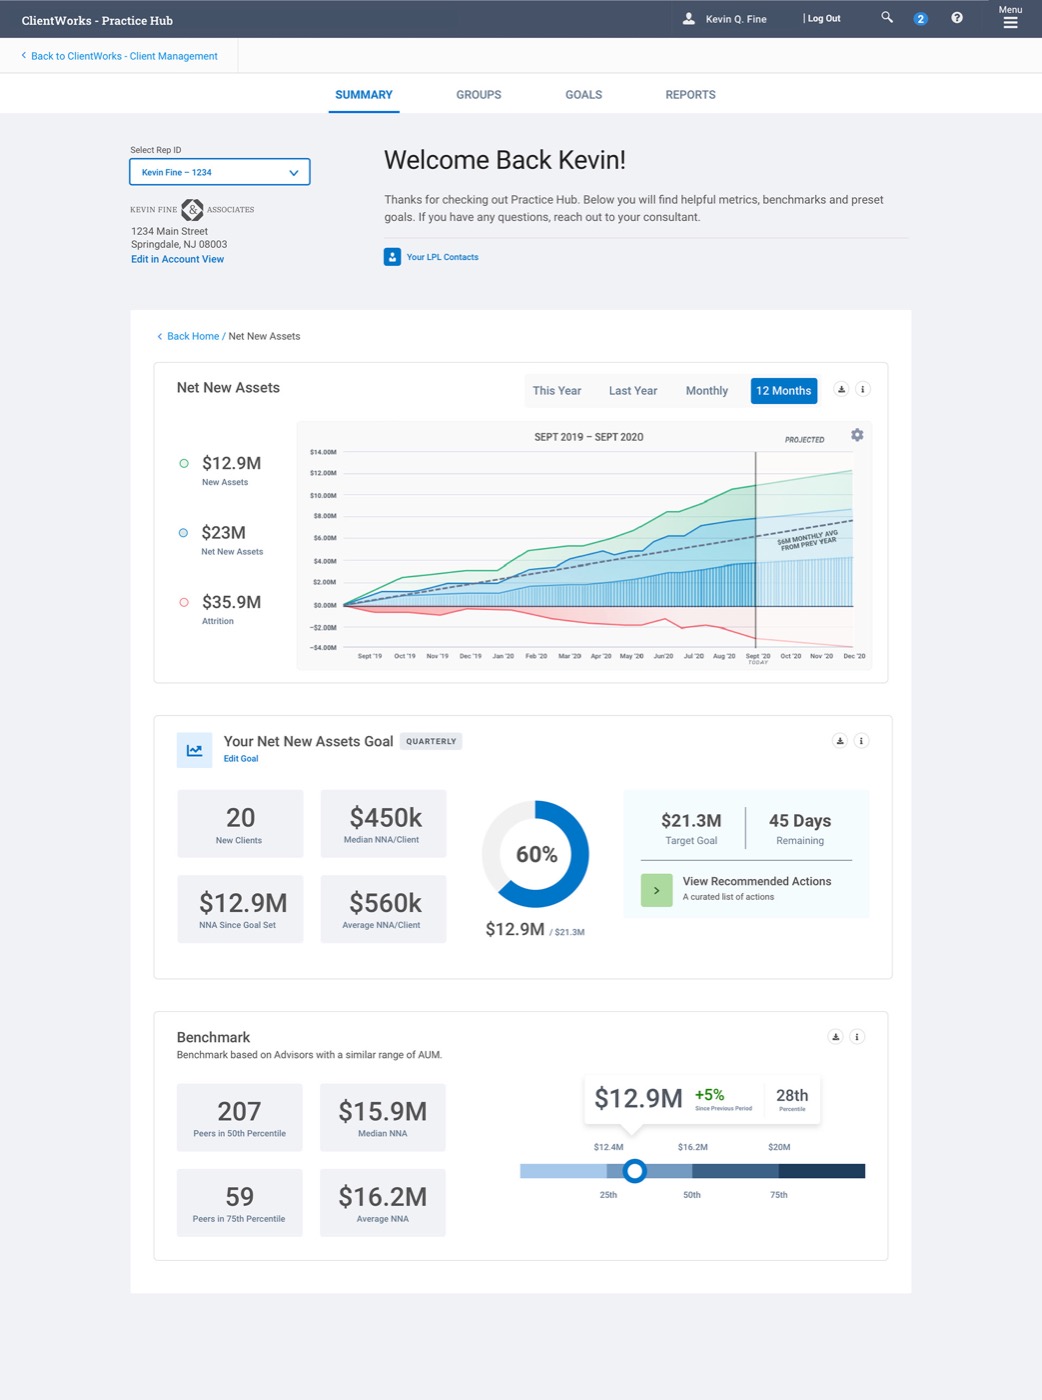
For the advisor the failure was concrete. Working with LPL’s analysts and stakeholders, we identified the four metrics that experienced, growing advisors actually watch — net new assets, revenue, AUM, and average client age. An advisor could already pull a report showing $12.9M in net new assets. What the report could not tell them was whether $12.9M was good, whether it was good for a practice their size, or what to do on Monday if it wasn’t.

The reframe
Advisors don’t need more data. They need a denominator.
$12.9M is not information. “28th percentile for practices your size” is information, and it is information only LPL can supply, because only the custodian can see the whole peer set. Putting a percentile beside every metric turned four numbers from a report into a diagnosis — and a diagnosis implies a next action, which is precisely what LPL wanted to sell. The benchmark was the product; the dashboard was the delivery mechanism.
The work
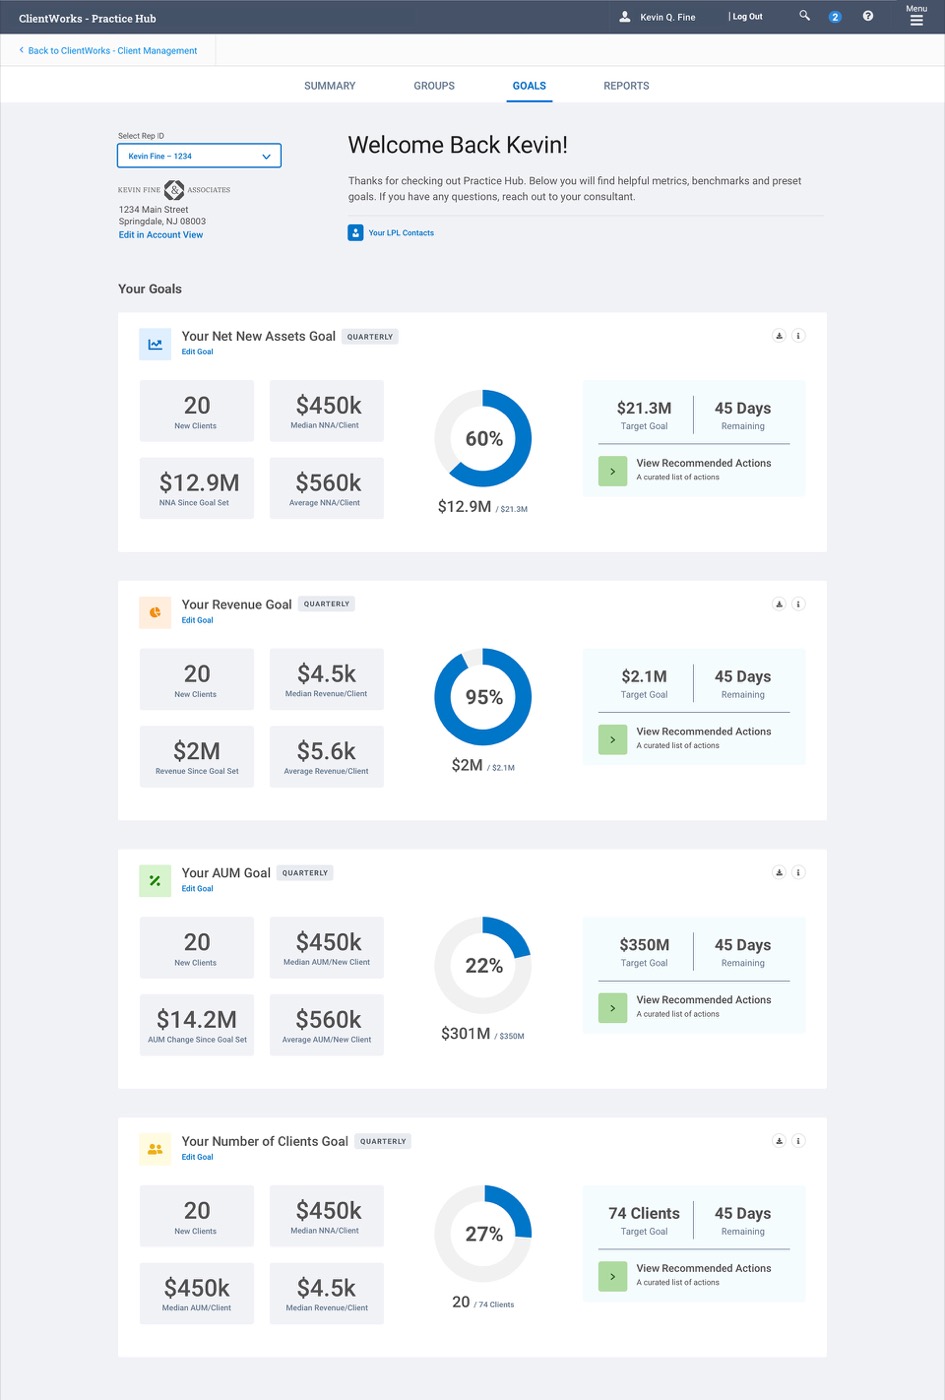
Four metrics, each with a peer percentile, a target, and days remaining.
Explorations that died
-
01 / 03
A library of thirty metrics
Advisors could not tell which of thirty mattered, which is the same problem as having none. The research was unambiguous that growing practices watch four.
-
02 / 03
An auto-written narrative summary
Generation quality in 2021 was uneven, and in a regulated context an unreviewable sentence about someone’s revenue is a compliance event, not a feature.
-
03 / 03
Named advisor leaderboard
Comparison against named peers tested as demoralising and raised obvious legal questions. Anonymous percentiles carried the same signal without the sting.
Tradeoffs
What got cut, and why.
- Custom goals. Advisors asked to set goals on metrics of their own choosing. Supporting that means a goal engine plus a peer benchmark for every arbitrary metric, and the benchmark is the part that does not exist. Four preset S.M.A.R.T. goals with adjustable targets shipped instead, and the constraint is what made the numbers trustworthy.
- Real-time data. Metrics refresh on LPL’s existing month-end and commission-cycle cadence. Live figures would have needed new pipelines and, worse, would have made numbers move for reasons an advisor could not explain to a client.
- Replacing the ClientWorks shell. The surrounding chrome is dated and every designer on the project wanted to fix it. Doing so would have moved the hub into a different release train and cost two quarters. We inherited the shell and spent the entire budget on the content inside it.
- “Compare me to a practice like mine.” The most requested thing in testing, and deliberately deferred: defining a peer group is a data-governance decision with regulatory implications. That was LPL’s call to make, not a detail for a design team to invent in a prototype.
Impact
62% of pilot advisors set a goal in week one.
-
62%
Of pilot advisors set a growth goal in week one.
Measured: goal-creation events divided by activated pilot accounts (n=340), within seven days of first login.
-
2.4×
Consultant meetings booked through the hub.
Measured: “Your LPL Contacts” click-through to a scheduled meeting, against the previous email-driven baseline over the same 90-day window.
-
4.4 / 5
Usefulness rating in moderated testing.
Measured: post-task rating from 12 advisors across three practice sizes, on the mid-fidelity prototype, before build.
Reflection
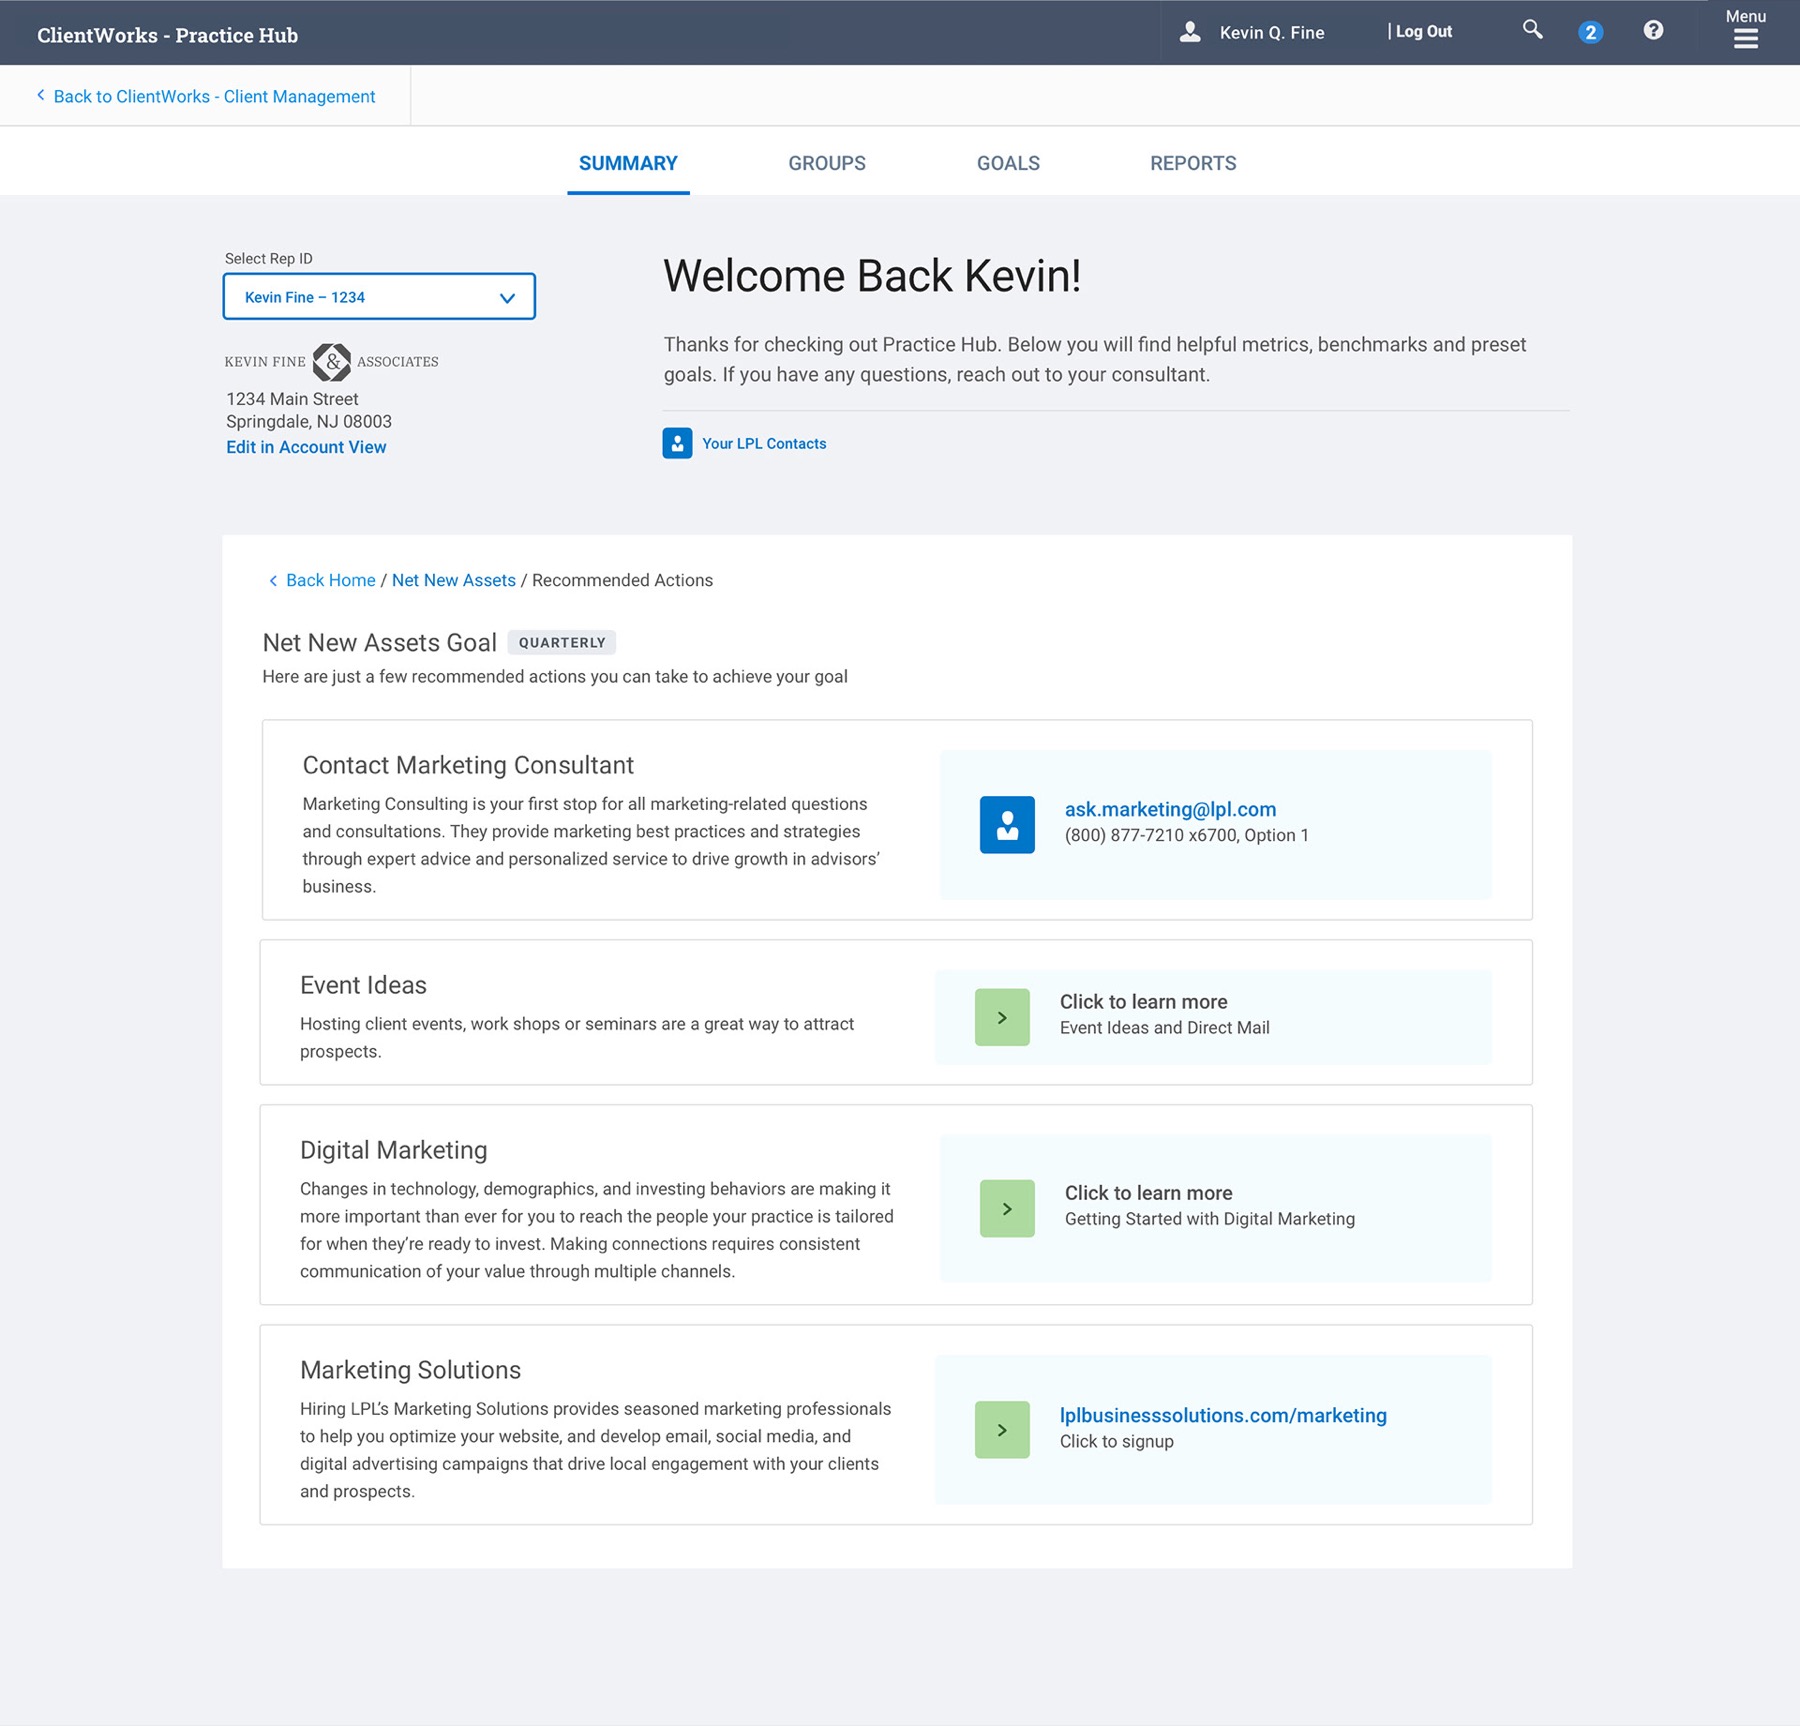
Percentiles did all the heavy lifting — the moment an advisor saw “28th”, the conversation moved from “is this good?” to “how do I move it?”. What I would push harder on is recommended actions, which shipped generic: they were the bridge from diagnosis to LPL’s actual services and we left them thin. A benchmark without a next step is just a nicer scoreboard.