
Torch
Learning goals for executive coaching
Two years
Weekly active use rose 3.4× after we stopped measuring leadership growth as a percentage.
The business problem
The coaches were the product. The software was the only thing that could scale.
Torch came out of Y Combinator with $2M and a genuinely strong asset: a vetted bench of executive coaches selling into high-growth tech companies. The problem with that asset is that it is billed by the hour. Enterprise L&D buyers renew on evidence of behaviour change across a cohort, and coaching hours produce anecdotes. The software was the only part of the business that could turn sixty coaches into a defensible product.
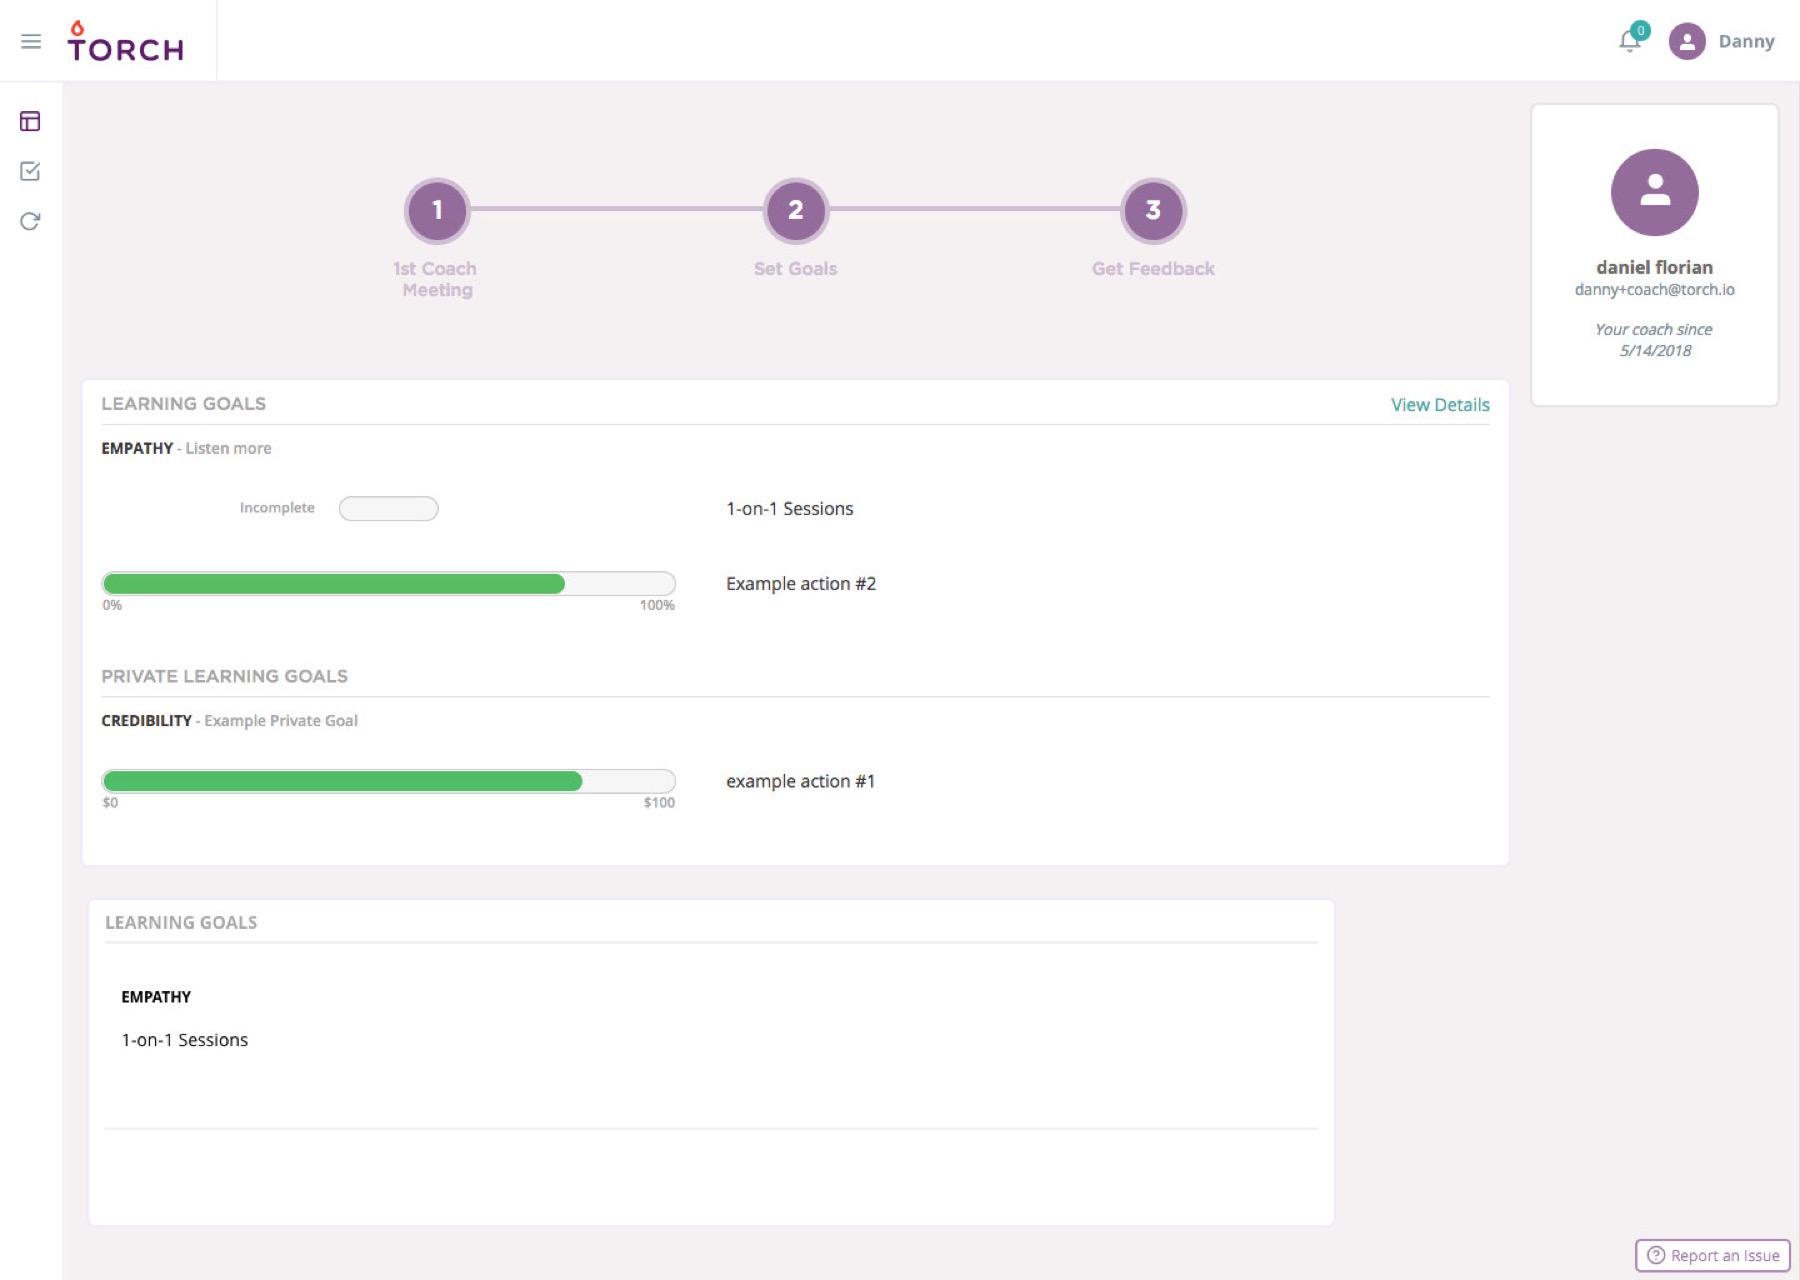
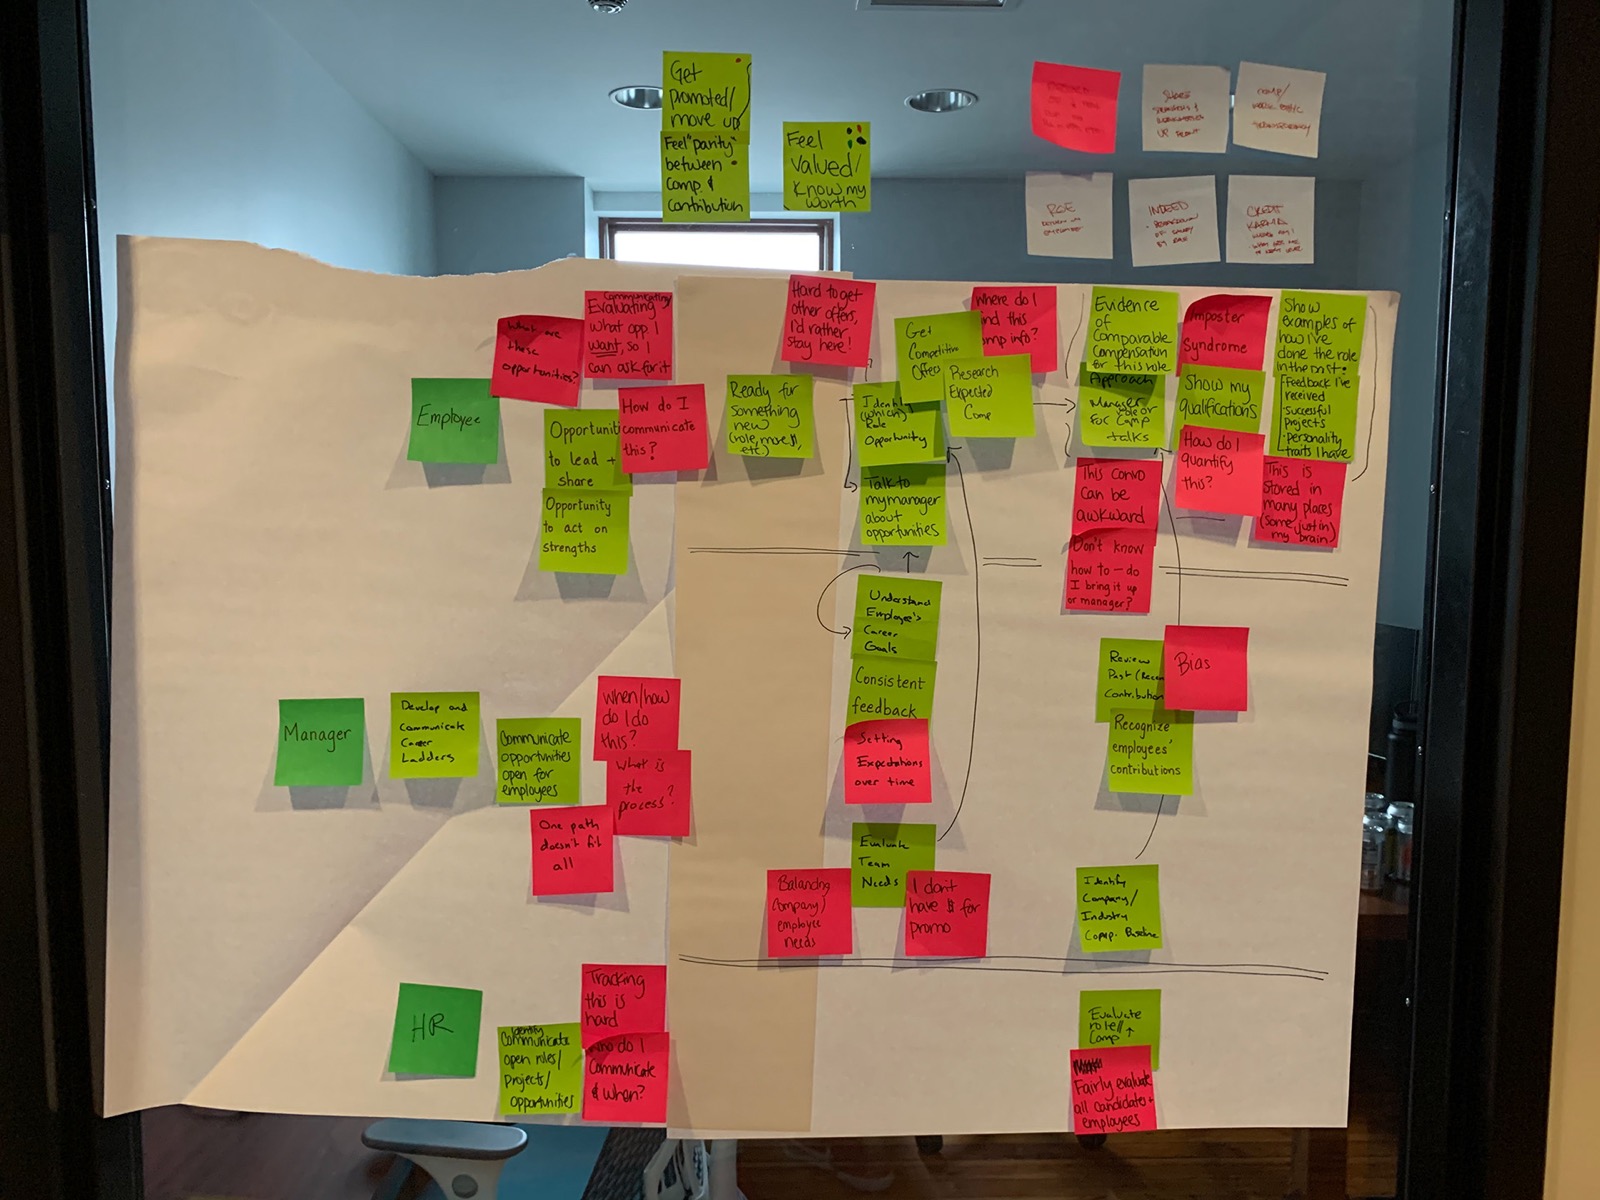
It wasn't doing that. Research in my first weeks found that clients logged in to get the video link and left. Nearly all measurable engagement was scheduling. The UI I inherited had been built by a contractor against an MVP spec, and the Learning Goals feature — the one surface that was supposed to represent progress — was a list of goals with a completion percentage next to each one.
That percentage was the whole problem. If your coach tells you to read a book, 50% is halfway through the book. If your goal is “make more eye contact so people feel heard”, there is no denominator, and a client staring at a progress bar they cannot honestly move simply stops opening the page. Coaches had no visibility either, so the one person equipped to intervene never saw a signal.
The reframe
Growth isn’t a percentage. It’s a balance.
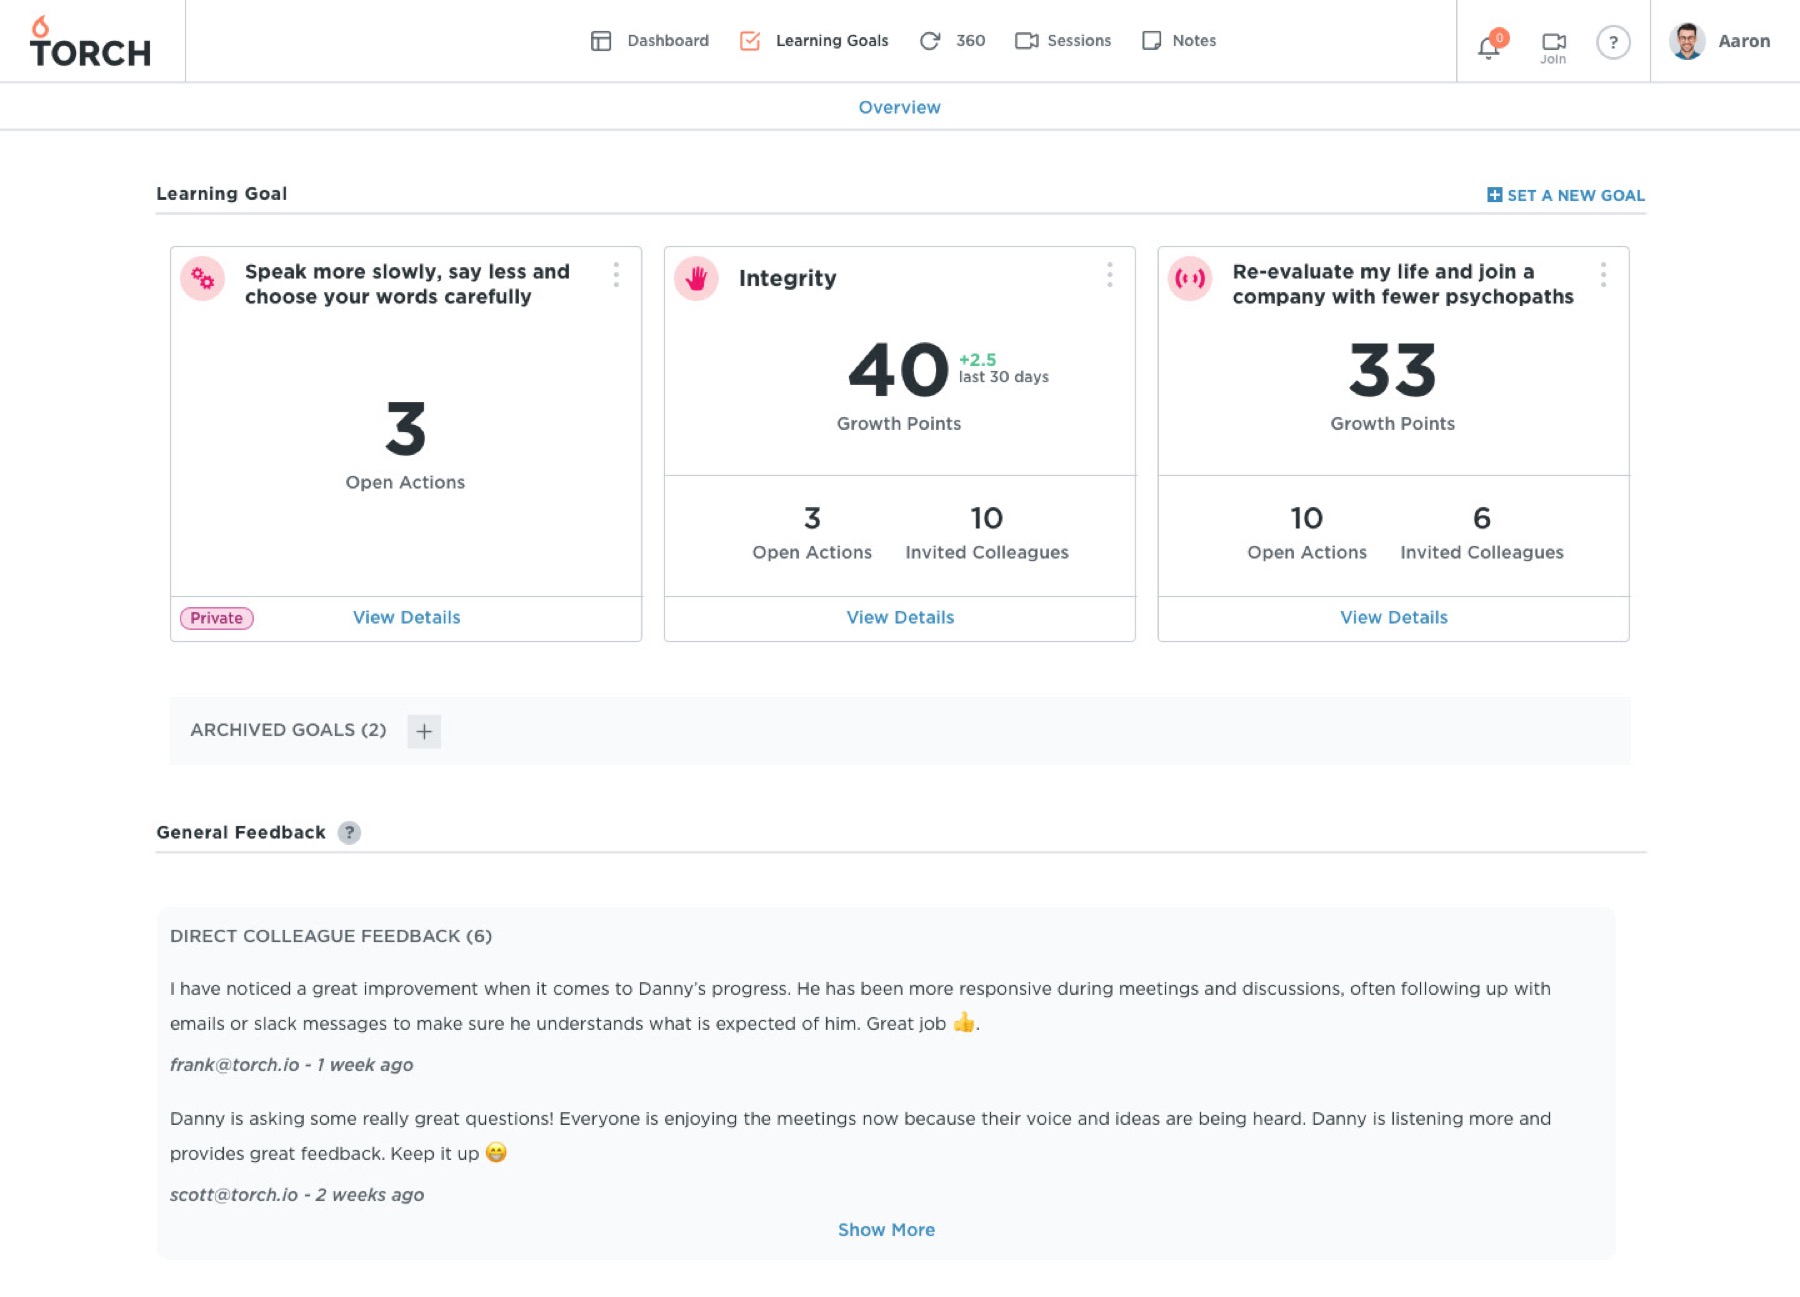
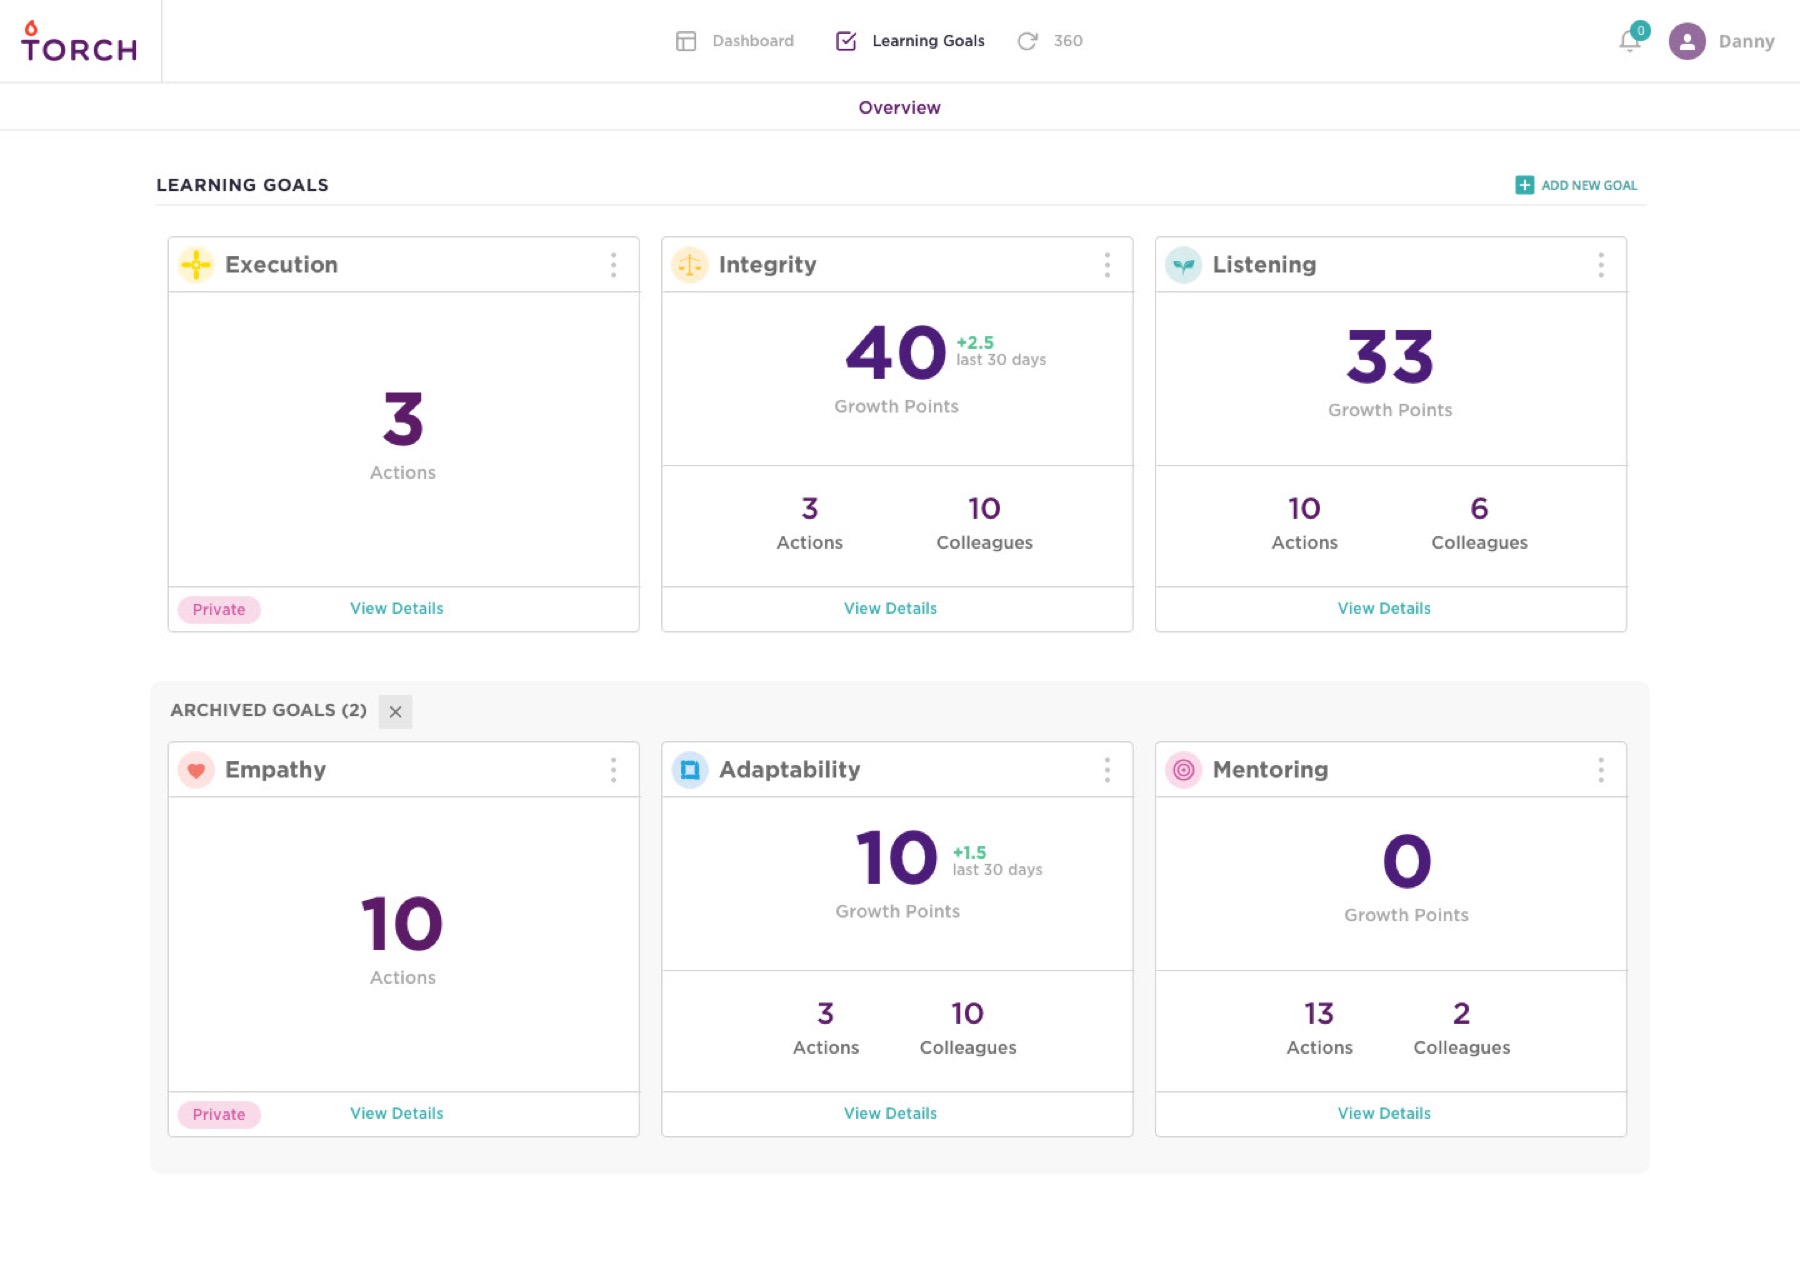
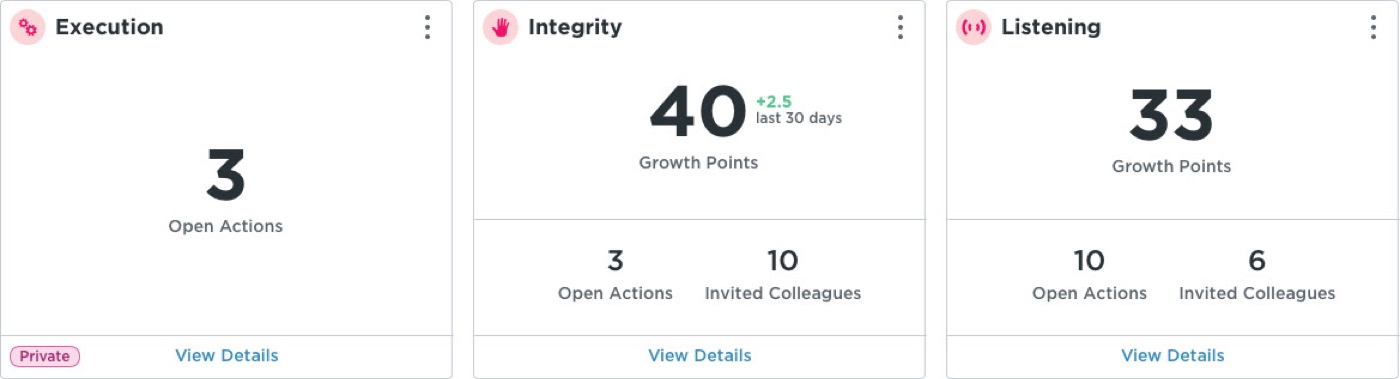
We were already collecting the signal we needed and throwing it away. Torch runs recurring 360 surveys — the client’s actual colleagues, rating Likert-scale statements on a fixed cadence. Treat the rolling average as a balance rather than a target, the way you read a bank account: the absolute number matters less than the rate of change over the last thirty days. Suddenly “read a book” and “be a better listener” are measurable by the same mechanic, human potential stops having a ceiling, and the metric comes from the client’s peers instead of the client’s own optimism.
The work
One number per goal, sourced from the people the goal is about.
Explorations that died
-
01 / 03
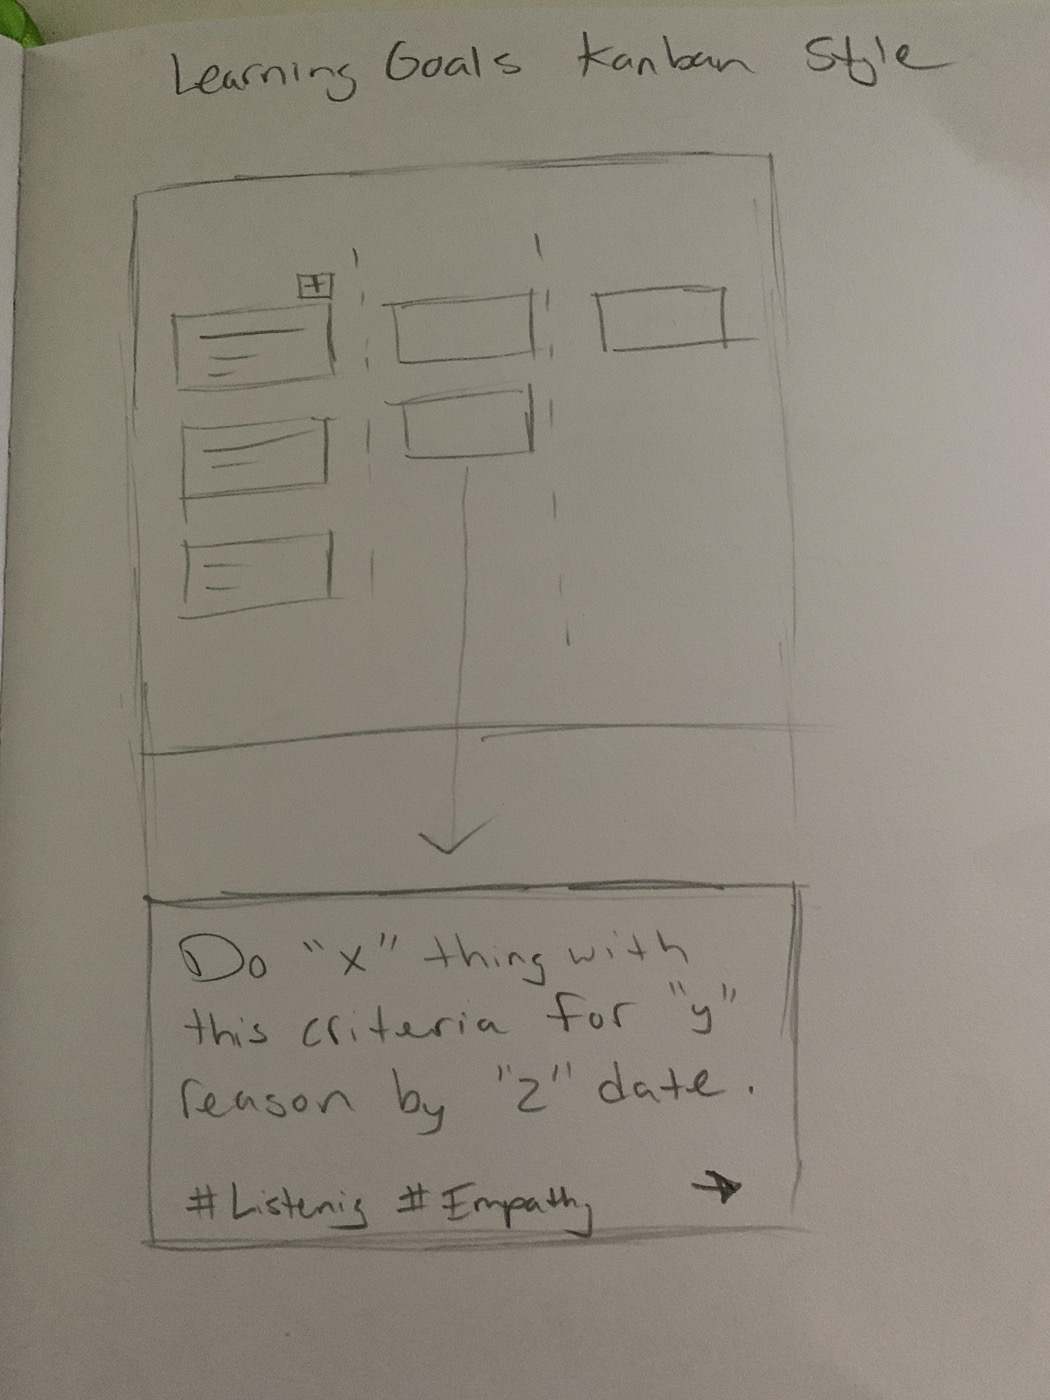
Kanban board of goals
Columns implied a finish line. Every column name we tried contradicted the premise that growth is continuous — but the compact card row survived into the shipped design.
-
02 / 03
Coach-assigned scores
Putting grading in the coach’s hands broke the coaching relationship. In testing, clients immediately began performing for their coach rather than reporting honestly.
-
03 / 03
Streaks and login rewards
It moved the engagement metric without moving a single 360 score. We would have been optimising the dashboard we used to prove the product worked.
Tradeoffs
What got cut, and why.
- The 360 survey redesign. Research said surveys were too long and gave no time expectation — the loudest single complaint in the product. I deferred the redesign a full quarter anyway, because Growth Points depended on survey data, not survey UX, and fixing the source first would have delayed the thing that proved the model. We shipped a one-line completion-time estimate as a patch and wrote the real redesign into the backlog.
- Manager and HR rollups. L&D buyers asked for aggregate org views in every sales call. Building a rollup of a number we were not yet certain about would have put an unvalidated score in front of the people who decide promotions.
- Public goals by default. Private-by-default measurably reduced the collaboration numbers we could show investors. It was still non-negotiable: coaching only works if a client can write down the goal they would never say in a standup.
- A fast first thirty days. Growth Points need at least two survey cycles before the rate of change means anything. Rather than seed a fake starting number, the empty state states the exact date the score will appear. New users see less; they also never see a number that lies.
Impact
Weekly active use rose 3.4×.
-
3.4×
Weekly active use of the platform.
Measured: distinct users taking at least one non-scheduling action per week. Eight weeks before launch vs. eight weeks after, cohort held constant.
-
71%
Of clients set a second learning goal.
Measured: clients creating a goal 30+ days after their first, over six months post-launch. Pre-launch baseline was 22% on the same definition.
-
+18
Points of NPS among enterprise L&D buyers.
Measured: quarterly buyer survey, n=54. Free-text answers moved from “the coaches are great” to “we can see it working.”
Reflection
Borrowing the bank-balance metaphor gave the whole company a shared way to argue about the number, which turned out to be worth more than the number. I under-invested in the coach side: coaches got visibility into a falling rate and no mechanism to act on it, and they were the only people who could. Next time I would design the intervention before the chart.